Fundamental analysis is the process of evaluating a company’s intrinsic value by examining its financial statements, management quality, competitive position, and macroeconomic context. Unlike technical analysis, which focuses on price charts and trading patterns, fundamental analysis asks a simpler question: Is this business worth more than the market thinks it is?
This guide covers the core framework every retail investor needs to analyze a company properly — from reading the three financial statements to calculating the ratios that actually matter.
If you are still choosing between approaches, read fundamental vs technical analysis first. If your question is more practical — “what tool or workflow should I use?” — see what to look for in a stock fundamental analysis tool.
Why Fundamental Analysis Matters for Long-Term Investors
Markets are efficient over the long run, but they can misprice companies in the short term due to fear, hype, or simple lack of attention. A company with strong free cash flow and a durable competitive advantage that trades at a low multiple is a classic fundamental opportunity.
The legendary investors — Buffett, Lynch, Greenblatt — all built their track records on variants of this same framework. The tools have changed, but the principles haven’t.
The Three Financial Statements Every Investor Should Know
Every public company files three core documents with regulators every quarter. These are the raw material of any fundamental analysis:
The Income Statement
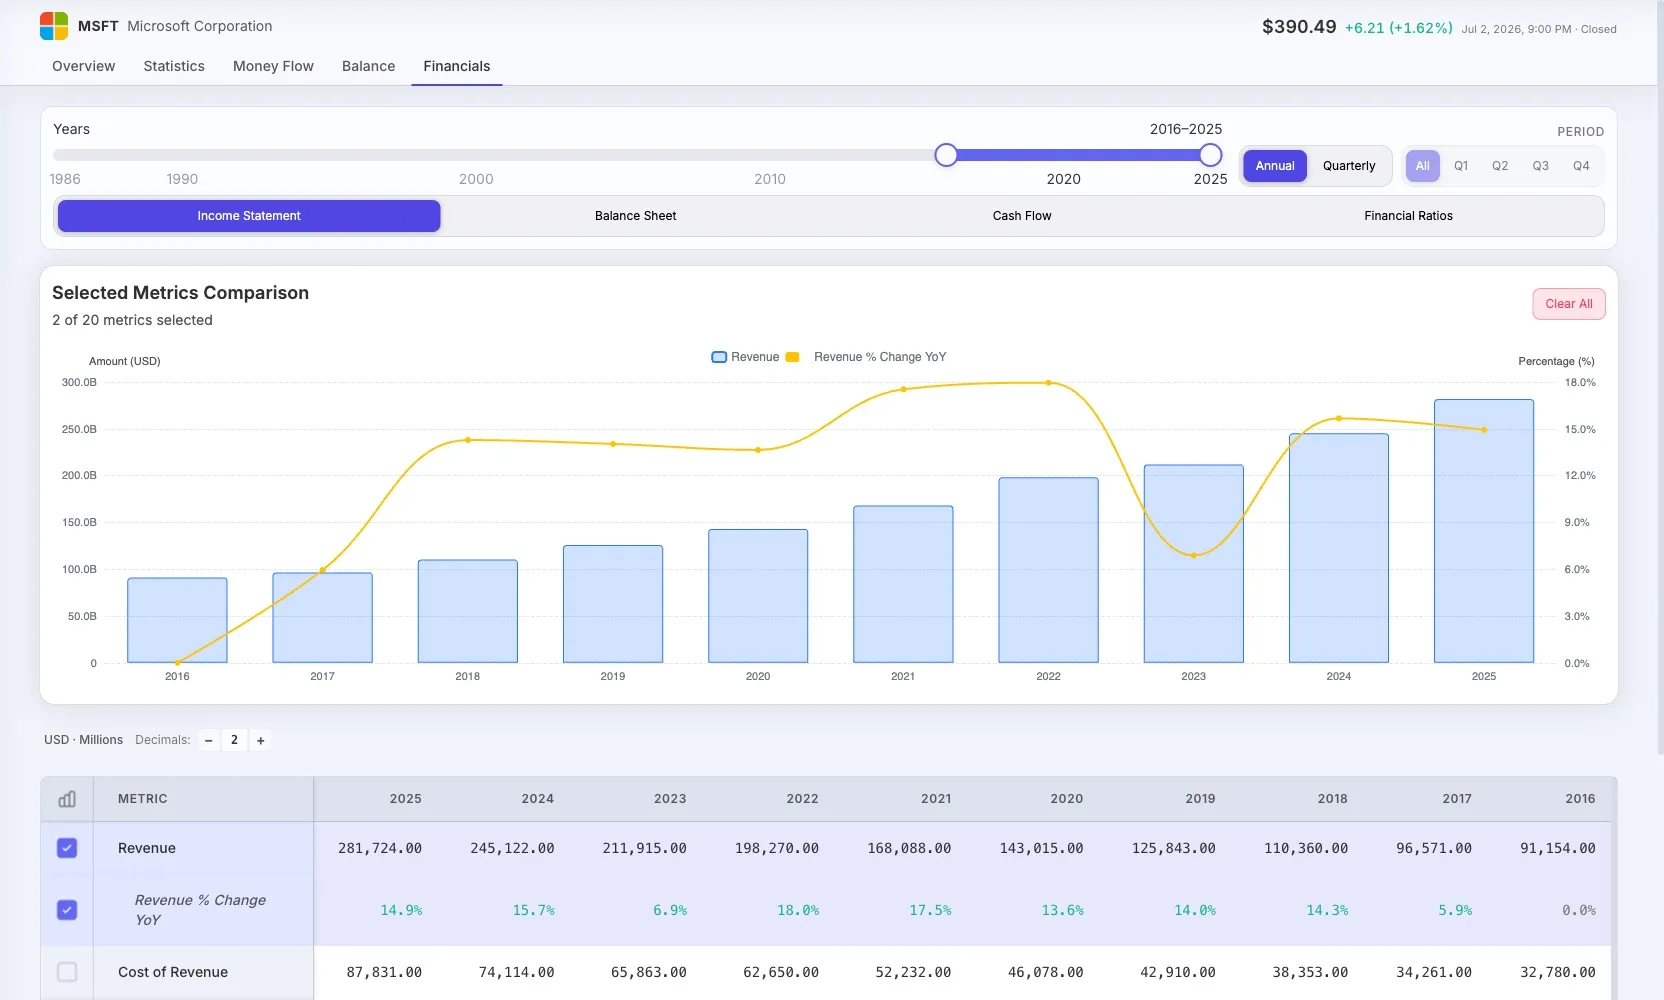
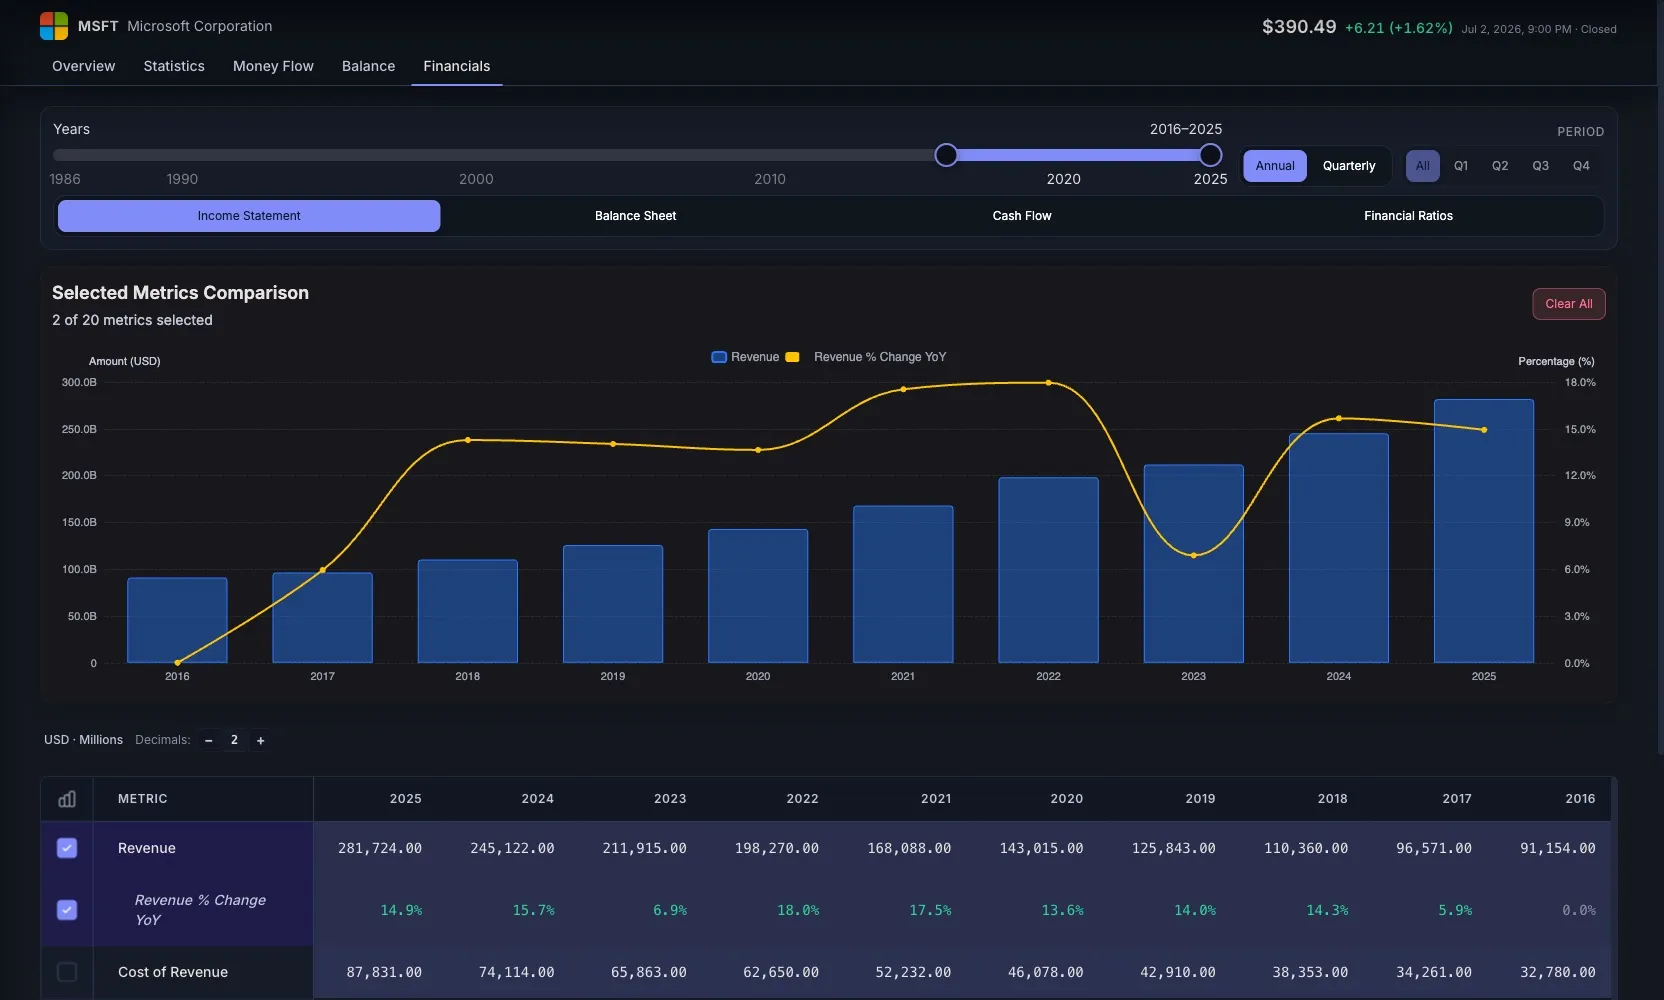
The income statement shows revenue, expenses, and profit over a period. Key lines to watch:
- Revenue — is it growing consistently, cyclically, or shrinking?
- Gross Margin — revenue minus cost of goods sold. Higher and stable margins signal pricing power.
- Operating Income (EBIT) — profit before interest and taxes. This is the core earning power of the business.
- Net Income — the bottom line, after taxes and interest. Can be distorted by one-time items; always check.
A business with growing revenue but shrinking margins is worth investigating — it may be investing for growth, or it may be losing pricing power.
The Balance Sheet
The balance sheet is a snapshot of what the company owns (assets) and owes (liabilities) at a point in time. Key metrics:
- Cash and equivalents — financial flexibility.
- Total Debt — long-term debt matters, but so does the maturity schedule.
- Shareholders’ Equity — the book value of the company.
- Debt/Equity ratio — how leveraged is the business?
A company with more cash than debt has optionality. A company drowning in debt has vulnerability. Understanding the balance sheet is how you separate financially healthy companies from ticking time bombs.
The Cash Flow Statement
This is the most honest of the three statements. Earnings can be manipulated through accounting choices; cash cannot. It breaks down into three sections:
- Operating Cash Flow (OCF) — cash generated by running the actual business.
- Capital Expenditure (CapEx) — cash spent on maintaining and growing assets.
- Free Cash Flow (FCF) = Operating Cash Flow − CapEx.
FCF is the oxygen of a business. Companies that consistently generate strong free cash flow relative to earnings are higher quality than those that don’t. If you only master one part of the financial statements, make it this one.
Tired of hunting for company data across 5 different sites? Join STOK Terminal free and follow how portfolio, watchlists and fundamentals come together.
Key Financial Ratios That Tell the Real Story
Raw numbers only make sense in context. Ratios normalize for company size and allow comparisons across businesses and time periods.
Profitability Ratios
| Ratio | Formula | What It Tells You |
|---|---|---|
| Gross Margin | Gross Profit / Revenue | Pricing power and cost structure |
| Operating Margin | EBIT / Revenue | Operational efficiency |
| Net Margin | Net Income / Revenue | Overall profitability |
| Return on Equity (ROE) | Net Income / Equity | Returns generated for shareholders |
| ROIC | NOPAT / Invested Capital | The real quality metric — see below |
Why ROIC Is the Most Important Metric
Return on Invested Capital (ROIC) is arguably the single most important metric in fundamental analysis. It measures how efficiently a company uses all capital invested in it — both debt and equity — to generate after-tax operating profit.
ROIC = NOPAT / Invested Capital
Where:
- NOPAT = Net Operating Profit After Tax
- Invested Capital = Total Equity + Total Debt − Cash
A business with ROIC consistently above its cost of capital is genuinely creating value. Very few companies manage to sustain ROIC above 15% for a full decade — and when they do, there is almost always a real competitive advantage behind it. This is the metric that separates compounders from capital destroyers.
Valuation Ratios for Stock Analysis
| Ratio | Formula | Notes |
|---|---|---|
| P/E | Price / Earnings per Share | Common but easily distorted by one-time items |
| EV/EBITDA | Enterprise Value / EBITDA | Better for comparing different capital structures |
| FCF Yield | Free Cash Flow / Market Cap | How much FCF you’re buying per dollar invested |
| P/B | Price / Book Value | Useful for banks; less relevant for asset-light businesses |
A low FCF Yield (say 2%) means you’re paying a premium for current earnings. A high FCF Yield (8–10%) means the market is pricing in slow growth or elevated risk — which may or may not be warranted. Understanding this distinction is at the core of value investing.
We have dedicated guides to the two most used multiples: what the P/E ratio is and when it misleads you and EV/EBITDA and Net Debt/EBITDA. And on the difference between ROE and ROIC — key to not mistaking quality for leverage — see ROE vs ROIC.
How to Build a Repeatable Research Process
Good fundamental analysis isn’t about finding a magic number — it’s about building a coherent picture of a business. Here’s a six-step process you can repeat for every stock:
- Screen — Use filters to find companies with improving ROIC, strong FCF, and reasonable valuations.
- Understand the business — Can you explain what they do in two sentences? Do they have a durable competitive advantage (moat)?
- Read 3–5 years of filings — Look for trends, not snapshots. Is revenue growing? Are margins expanding or compressing?
- Stress-test the thesis — What would have to be true for this investment to fail? Is that likely?
- Assign a valuation range — Based on normalized FCF, what is a reasonable range of intrinsic value? What margin of safety do you have?
- Decide and size — Higher conviction + larger margin of safety = larger position.
The key word here is repeatable. A consistent process beats sporadic brilliance every single time.
For the first step, use our dedicated guide on how to screen stocks. For the pricing step, continue with how to value a company. And once a business is good but not yet cheap, keep it organized with a proper stock watchlist.
Common Fundamental Analysis Mistakes to Avoid
Looking at P/E in isolation. A 15x P/E on a business with declining margins and rising debt is not cheap — it might be a value trap.
Ignoring the debt maturity schedule. A company with 8x leverage maturing in 3 months is vastly different from one with the same leverage due in 10 years. The balance sheet tells you when the risk hits, not just how much.
Anchoring to past price. “It’s down 50%, it must be cheap” is not fundamental analysis. A stock that fell from overvalued to fairly valued isn’t a bargain.
Ignoring management incentives. Check how executives are compensated. If they earn bonuses on revenue rather than ROIC, they will maximize revenue — often at the expense of profitability and shareholder value.
Conclusion: Fundamental Analysis Is a Skill That Compounds
If this is how you invest, see how STOK Terminal supports a value investing research workflow without replacing your judgment with scores or signals.
The first few analyses feel slow and uncertain. By the hundredth, pattern recognition kicks in — you can spot an anomaly in a cash flow statement within minutes, or recognize a great capital allocator from the trajectory of their ROIC over a decade.
The tools available to retail investors today are dramatically better than they were even five years ago. The edge is no longer about access to data — it’s about the quality of the framework and the discipline to apply it consistently. (And if you’re wondering whether AI can do this for you, read our honest take on using ChatGPT and Gemini for stock analysis — useful for reasoning, unreliable for figures.)
Frequently Asked Questions
What is fundamental analysis? It is the process of estimating a company’s intrinsic value by studying its financial statements, competitive position and management team, to decide whether the market price is above or below that value.
How do you do fundamental analysis of a stock? In six steps: screen for candidates, understand the business model, read 3–5 years of filings looking for trends in revenue, margins and cash, stress-test the thesis, assign a valuation range with a margin of safety, and size the position.
What are the most important metrics in fundamental analysis? Multi-year trends in revenue and margins, free cash flow (FCF), ROIC, and the level and maturity schedule of debt. No single ratio is enough: the picture comes from combining them.
Fundamental analysis or technical analysis? They are different approaches: fundamental analysis studies the business for long-term investing; technical analysis studies the price chart for short-term trading. This guide covers the former.
How long does it take to analyze a company? A serious first pass — reading the latest annual report and reviewing five years of fundamentals — can be done in one to two hours. Depth grows with conviction: the bigger the position, the more work.
This article is for informational purposes only and does not constitute financial advice or investment recommendations. Always verify data against official sources before making decisions.
Start Analyzing Stocks the Right Way
STOK Terminal brings company fundamentals, watchlists, portfolio tracking and market view into one focused workflow. Less manual work to gather the basics of one company.
👉 Join STOK Terminal free — fundamental analysis, simplified.